Archiving pfSense logs using Logstash, Elastic Search and Kibana on Debian 7
Introduction
After experimenting with various logging solutions like rsyslog+MySQL, Splunk and a few others I finally had the guts to through the process of setting up a VM and configuring Logstash.
Reading multiple blog posts and introductions I was convinced that I didn’t want to try Logstash as it requires Java - and I’m not a huge fan of Java and it’s bloat. But to my surprise the installation of the Logstash+ElasticSearch+Kibana stack on a vanilla Debian 7 system is pretty painless and very fast.
Hint:
Every version of Logstash is developed to work with a specific version of ElasticSearch. So pay close attention to the excellent docs provided by Logstash: http://logstash.net/docs/1.4.2
Our stack will consist of:
-
Logstash - Log collection and parsing
-
ElasticSearch - Storage
-
Kibana - Frontend
-
Redis - Log aggregation and transport
-
Nginx - Hosting the Kibana frontend
Preparing the Debian sources.list
Luckily the maintainers of ElasticSearch provide ready to use Debian repositories for every version of Logstash and ElasticSearch. I used the 1.4.x version of Logstash and ElasticSearch 1.2.x.
The following two lines need to be added to /etc/apt/sources.list:
deb http://packages.elasticsearch.org/logstash/1.4/debian stable main
deb http://packages.elasticsearch.org/elasticsearch/1.2/debian stable main
Installation
The installation is pretty straightforward - we only need to instruct apt to install the required packages:
apt-get install logstash elasticsearch redis-server libcap2-bin nginx-full
After the installation the services need to be added to the boot sequence:
update-rc.d redis-server defaults
update-rc.d elasticsearch defaults
update-rc.d logstash defaults
update-rc.d nginx defaults
Kibana
Since Kibana consists only of static HTML & JavaScript files no installation is needed. The only thing we need is to download and extract the package.
mkdir /var/www && cd /var/www
wget https://download.elasticsearch.org/kibana/kibana/kibana-3.1.0.tar.gz
tar xfz kibana-3.1.0.tar.gz
rm kibana-3.1.0.tar.gz
ln -s kibana-3.1.0 kibana
Configuration
The configuration of advanced features and security settings won’t be discussed here. Please refer to the documentation of the involved components to secure the environment properly. In the case of this VM it’s placed in a seperate logging segment that is only accessible from selected IP addresses.
Kibana
In new versions of Kibana the default Dashboard needs to be set separately.
We’ll just use the default logstash.json:
cd /var/www/kibana/app/dashboards
rm default.json
ln -s logstash.json default.json
ElasticSearch
Since the ES service doesn’t need to be available from the network we specify the local address as 127.0.0.1 to listen on the loopback interface:
cluster.name: mySecretCluster
node.name: "mySecretCluster"
network.host: 127.0.0.1
Logstash
The configuration of Logstash is a little more complex as you need to configure what parsing rules will be applied to the syslog inputs. I used the configuration of Raging Computer.
Using this configuration logstash waits for syslog messages on port 1514.
input {
    tcp {
        type => syslog
        port => 1514
    }
    udp {
        type => syslog
        port => 1514
    }

}

filter {
    if [host] =~ /10.10.10.1/ {
        grok {
            add_tag => [ "firewall" ]
            match => [ "message", "<(?<evtid>.*)>(?<datetime>(?:Jan(?:uary)?|Feb(?:ruary)?|Mar(?:ch)?|Apr(?:il)?|May|Jun(?:e)?|Jul(?:y)?|Aug(?:ust)?|Sep(?:tember)?|Oct(?:ober)?|Nov(?:ember)?|Dec(?:ember)?)\s+(?:(?:0[1-9])|(?:[12][0-9])|(?:3[01])|[1-9]) (?:2[0123]|[01]?[0-9]):(?:[0-5][0-9]):(?:[0-5][0-9])) (?<prog>.*?): (?<msg>.*)" ]
        }
        mutate {
            gsub => ["datetime","  "," "]
        }
        date {
            match => [ "datetime", "MMM dd HH:mm:ss" ]
        }
        mutate {
            replace => [ "message", "%{msg}" ]
        }
        mutate {
            remove_field => [ "msg", "datetime" ]
        }
    }
    if [prog] =~ /^pf$/ {
        mutate {
            add_tag => [ "packetfilter" ]
        }
        multiline {
            pattern => "^\s+|^\t\s+"
            what => "previous"
        }
        mutate {
            remove_field => [ "msg", "datetime" ]
            remove_tag => [ "multiline" ]
        }
        grok {
            match => [ "message", "rule (?<rule>.*)\(.*\): (?<action>pass|block) .* on (?<iface>.*): .* proto (?<proto>TCP|UDP|IGMP|ICMP) .*\n\s*(?<src_ip>(\d+\.\d+\.\d+\.\d+))\.?(?<src_port>(\d*)) [<|>] (?<dest_ip>(\d+\.\d+\.\d+\.\d+))\.?(?<dest_port>(\d*)):" ]
        }
    }
    if [prog] =~ /^dhcpd$/ {
        if [message] =~ /^DHCPACK|^DHCPREQUEST|^DHCPOFFER/ {
            grok {
                match => [ "message", "(?<action>.*) (on|for|to) (?<src_ip>[0-2]?[0-9]?[0-9]\.[0-2]?[0-9]?[0-9]\.[0-2]?[0-9]?[0-9]\.[0-2]?[0-9]?[0-9]) .*(?<mac_address>[0-9a-fA-F][0-9a-fA-F]:[0-9a-fA-F][0-9a-fA-F]:[0-9a-fA-F][0-9a-fA-F]:[0-9a-fA-F][0-9a-fA-F]:[0-9a-fA-F][0-9a-fA-F]:[0-9a-fA-F][0-9a-fA-F]).* via (?<iface>.*)" ]
            }
        }
        if [message] =~ /^DHCPDISCOVER/ {
            grok {
                match => [ "message", "(?<action>.*) from (?<mac_address>[0-9a-fA-F][0-9a-fA-F]:[0-9a-fA-F][0-9a-fA-F]:[0-9a-fA-F][0-9a-fA-F]:[0-9a-fA-F][0-9a-fA-F]:[0-9a-fA-F][0-9a-fA-F]:[0-9a-fA-F][0-9a-fA-F]).* via (?<iface>.*)" ]
            }
        }
        if [message] =~ /^DHCPINFORM/ {
            grok {
                match => [ "message", "(?<action>.*) from (?<src_ip>.*).* via (?<iface>.*)" ]
            }
        }
    }
}

output {

  elasticsearch {
    host => "127.0.0.1"
    cluster => "mySecretCluster"
  }
}
Nginx
The Kibana installation is placed under /var/www/kibana. And is accessible
using http://logstash/kibana
server {
    listen   80;
    root /var/www;
    index index.html index.htm;

    server_name logstash;

    location / {
        try_files $uri $uri/ /index.html;
    }

    location /elasticsearch {
        rewrite /elasticsearch/(.*) /$1  break;
        proxy_pass http://127.0.0.1:9200;
        proxy_redirect     off;
        rewrite_log on;
    }
}
Conclusions
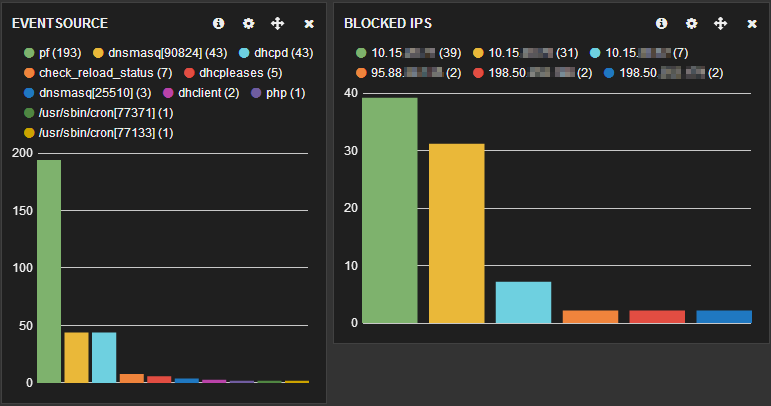
The installation and configuration is easy and Kibana really rocks for log analysis. By customizing the logstash dashboard you’re able to create pretty powerful overviews of your log data.
As with all systems you should consider using iptables to restrict access to the necessary services and IP addresses.
 marpie
 @markus_pieton