All Entries
Vulnerability Disclosure Policy
This documents outlines a responsible disclosure model to publish security vulnerabilities. In the course of responsible disclosure vendors may sometimes try to delay fixing of vulnerabilities indefinitely. To counter this move a more strict approach is chosen to make sure a fix will be provided in a reasonable time or the details are disclosed publicly to make sure other mitigations can be established.
Found vulnerabilities will be disclosed to the vendor; if the vendor does not reply or a fix is not available after 45 days the vulnerability details will be released to the public.
Communication
The communication is done via e-mail only; no contact forms, issue-trackers or other means of communication will be used.
Vulnerability Classes
Upon discovery, vulnerabilities will be categorized in one of four severity classes (taken from the chromium project).
Critical Severity
Allows an attacker run arbitrary code with the user's privileges in the normal course of usage.
For critical vulnerabilities, a patch needs to be provided in under 30 days. If a fix is available for at least 14 days the vulnerability details are made public - or 45 days after the vendor was informed of the issue. If there is evidence of active exploitation the details are published after 7 days.
High Severity
Allows an attacker to read or modify confidential data belonging to other entities.
The vulnerability details are published 30 days after the vendor was notified.
Medium Severity
Allows an attacker to obtain limited amounts of information.
The vulnerability details are published 30 days after the vendor was notified.
Low Severity
Allows an attacker temporary control over non-critical features.
The vulnerability details are published 30 days after the vendor was notified.
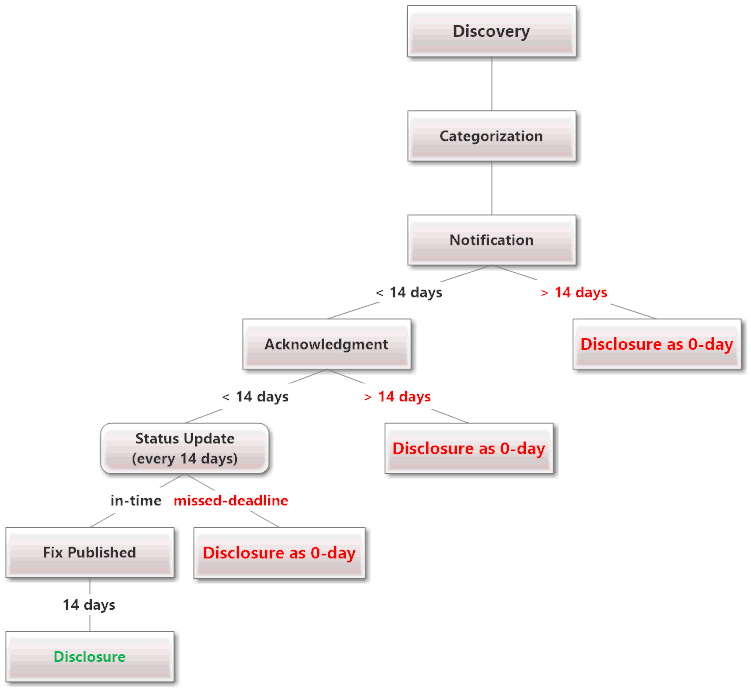
At a glance …
- Notification. The vendor will be notified by e-mail describing the discovery of a security vulnerability. This will be done using the following addresses:
security@,security-alert@,support@,secalert@,psirt@. Alternatively the e-mail will be sent to:abuse@,postmaster@,sales@,info@ - Acknowledgment. The vulnerability has to be acknowledged after at most 14 days. A failure to comply may trigger the publication of the vulnerability details.
- Status Update. A status update needs to be given by the vendor every 14 days (or a otherwise agreed time-frame).
- Disclosure-Deadline. The disclosure of the vulnerability will be done in accordance to the aforementioned severity classes.
- Missed-Deadline. If a vendor misses a deadline or refuses to fix / cooperate the details of the vulnerability may be published immediately. A applicable workaround may be given if available.
- Weekends. If a disclosure date would be a weekend the deadline will be moved to the next work day.
- Grace-period. A 14-day grace period may be granted if a patch is released in this time-frame.
- CVEs. Before publication a CVE will be requested to be published alongside the vulnerability report.
Exceptions
Some vulnerabilities need more time to be fixed correctly (e.g. design errors, issues in widely-deployed applications, etc.). Therefore more time may be granted for these bugs. This is up to the researcher - not the vendor.
Acknowledgment of the vulnerability
If the vendor publicly discloses details to this vulnerability the following acknowledgment line should be used:
ACKNOWLEDGEMENT
This vulnerability was reported to <vendor> by Markus Piéton (www.a12d404.net).
Using the newest VMware tools (from VMware Workstation 10) with VMware Workstation 9.x
The last couple of month I had issues with my Kali Linux pentesting VM. After updating the kernel to 3.14 the VMware tools didn’t compile anymore. More precisely the HGFS (Shared Folders) kernel module didn’t compile. Since I’m using VMware Workstation 9 (and don’t want to upgrade - yet) I needed a way to get the newest version of the tools that fixed that issue.
After a little googeling I found the update site that hosts the newest additions for all VMware products.
http://softwareupdate.vmware.com/cds/vmw-desktop/ws/
The content we’re interested in can be found here: http://softwareupdate.vmware.com/cds/vmw-desktop/ws/10.0.2/1744117/linux/packages/
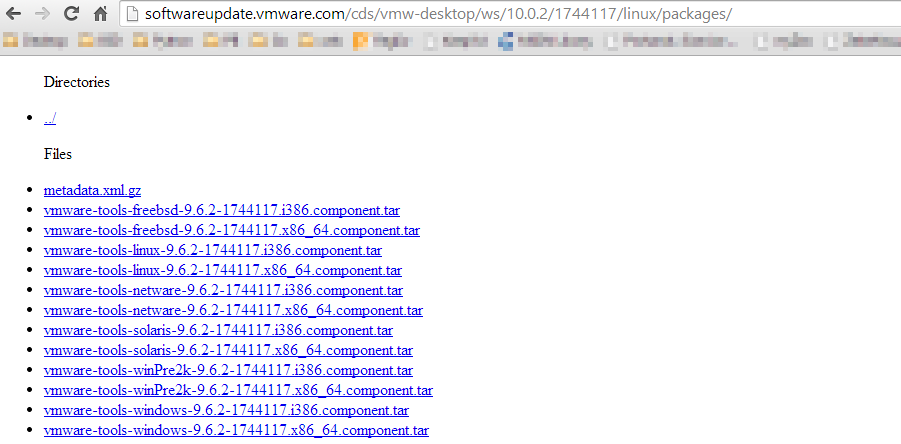
The files get delivered as so called “.component.tar” files - a custom format by VMware. To extract these files the open source tool “VMWare-Component-Extractor” by Nick Glynn can be used (a ready to use x64 binary can be found at the end of this post).
~$ VMWareComponentExtractor_x86-64 vmware-tools-linux-9.6.2-1744117.x86_64.component.tar
Since I had problems specifying relative paths to the component-file I suggest placing the file in the same folder as the binary. Afterwards the “linux.iso” file will be available in the same folder as the source file.
I mounted the ISO file in my VMware Workstation and updated the VMware tool package for my Kali Linux VM. After a reboot the HGFS (Share Folders) feature worked again flawlessly.
Binary and Source
I cloned the repository to be sure that it doesn’t vanish and provide the binary with the source.
Original Author:
Nick Glynn (17twenty) - Github: https://github.com/17twenty/VMWare-Component-Extractor
Archiving pfSense logs using Logstash, Elastic Search and Kibana on Debian 7
Introduction
After experimenting with various logging solutions like rsyslog+MySQL, Splunk and a few others I finally had the guts to through the process of setting up a VM and configuring Logstash.
Reading multiple blog posts and introductions I was convinced that I didn’t want to try Logstash as it requires Java - and I’m not a huge fan of Java and it’s bloat. But to my surprise the installation of the Logstash+ElasticSearch+Kibana stack on a vanilla Debian 7 system is pretty painless and very fast.
Hint:
Every version of Logstash is developed to work with a specific version of ElasticSearch. So pay close attention to the excellent docs provided by Logstash: http://logstash.net/docs/1.4.2
Our stack will consist of:
-
Logstash - Log collection and parsing
-
ElasticSearch - Storage
-
Kibana - Frontend
-
Redis - Log aggregation and transport
-
Nginx - Hosting the Kibana frontend
Preparing the Debian sources.list
Luckily the maintainers of ElasticSearch provide ready to use Debian repositories for every version of Logstash and ElasticSearch. I used the 1.4.x version of Logstash and ElasticSearch 1.2.x.
The following two lines need to be added to /etc/apt/sources.list:
deb http://packages.elasticsearch.org/logstash/1.4/debian stable main
deb http://packages.elasticsearch.org/elasticsearch/1.2/debian stable main
Installation
The installation is pretty straightforward - we only need to instruct apt to install the required packages:
apt-get install logstash elasticsearch redis-server libcap2-bin nginx-full
After the installation the services need to be added to the boot sequence:
update-rc.d redis-server defaults
update-rc.d elasticsearch defaults
update-rc.d logstash defaults
update-rc.d nginx defaults
Kibana
Since Kibana consists only of static HTML & JavaScript files no installation is needed. The only thing we need is to download and extract the package.
mkdir /var/www && cd /var/www
wget https://download.elasticsearch.org/kibana/kibana/kibana-3.1.0.tar.gz
tar xfz kibana-3.1.0.tar.gz
rm kibana-3.1.0.tar.gz
ln -s kibana-3.1.0 kibana
Configuration
The configuration of advanced features and security settings won’t be discussed here. Please refer to the documentation of the involved components to secure the environment properly. In the case of this VM it’s placed in a seperate logging segment that is only accessible from selected IP addresses.
Kibana
In new versions of Kibana the default Dashboard needs to be set separately.
We’ll just use the default logstash.json:
cd /var/www/kibana/app/dashboards
rm default.json
ln -s logstash.json default.json
ElasticSearch
Since the ES service doesn’t need to be available from the network we specify the local address as 127.0.0.1 to listen on the loopback interface:
cluster.name: mySecretCluster
node.name: "mySecretCluster"
network.host: 127.0.0.1
Logstash
The configuration of Logstash is a little more complex as you need to configure what parsing rules will be applied to the syslog inputs. I used the configuration of Raging Computer.
Using this configuration logstash waits for syslog messages on port 1514.
input {
    tcp {
        type => syslog
        port => 1514
    }
    udp {
        type => syslog
        port => 1514
    }

}

filter {
    if [host] =~ /10.10.10.1/ {
        grok {
            add_tag => [ "firewall" ]
            match => [ "message", "<(?<evtid>.*)>(?<datetime>(?:Jan(?:uary)?|Feb(?:ruary)?|Mar(?:ch)?|Apr(?:il)?|May|Jun(?:e)?|Jul(?:y)?|Aug(?:ust)?|Sep(?:tember)?|Oct(?:ober)?|Nov(?:ember)?|Dec(?:ember)?)\s+(?:(?:0[1-9])|(?:[12][0-9])|(?:3[01])|[1-9]) (?:2[0123]|[01]?[0-9]):(?:[0-5][0-9]):(?:[0-5][0-9])) (?<prog>.*?): (?<msg>.*)" ]
        }
        mutate {
            gsub => ["datetime","  "," "]
        }
        date {
            match => [ "datetime", "MMM dd HH:mm:ss" ]
        }
        mutate {
            replace => [ "message", "%{msg}" ]
        }
        mutate {
            remove_field => [ "msg", "datetime" ]
        }
    }
    if [prog] =~ /^pf$/ {
        mutate {
            add_tag => [ "packetfilter" ]
        }
        multiline {
            pattern => "^\s+|^\t\s+"
            what => "previous"
        }
        mutate {
            remove_field => [ "msg", "datetime" ]
            remove_tag => [ "multiline" ]
        }
        grok {
            match => [ "message", "rule (?<rule>.*)\(.*\): (?<action>pass|block) .* on (?<iface>.*): .* proto (?<proto>TCP|UDP|IGMP|ICMP) .*\n\s*(?<src_ip>(\d+\.\d+\.\d+\.\d+))\.?(?<src_port>(\d*)) [<|>] (?<dest_ip>(\d+\.\d+\.\d+\.\d+))\.?(?<dest_port>(\d*)):" ]
        }
    }
    if [prog] =~ /^dhcpd$/ {
        if [message] =~ /^DHCPACK|^DHCPREQUEST|^DHCPOFFER/ {
            grok {
                match => [ "message", "(?<action>.*) (on|for|to) (?<src_ip>[0-2]?[0-9]?[0-9]\.[0-2]?[0-9]?[0-9]\.[0-2]?[0-9]?[0-9]\.[0-2]?[0-9]?[0-9]) .*(?<mac_address>[0-9a-fA-F][0-9a-fA-F]:[0-9a-fA-F][0-9a-fA-F]:[0-9a-fA-F][0-9a-fA-F]:[0-9a-fA-F][0-9a-fA-F]:[0-9a-fA-F][0-9a-fA-F]:[0-9a-fA-F][0-9a-fA-F]).* via (?<iface>.*)" ]
            }
        }
        if [message] =~ /^DHCPDISCOVER/ {
            grok {
                match => [ "message", "(?<action>.*) from (?<mac_address>[0-9a-fA-F][0-9a-fA-F]:[0-9a-fA-F][0-9a-fA-F]:[0-9a-fA-F][0-9a-fA-F]:[0-9a-fA-F][0-9a-fA-F]:[0-9a-fA-F][0-9a-fA-F]:[0-9a-fA-F][0-9a-fA-F]).* via (?<iface>.*)" ]
            }
        }
        if [message] =~ /^DHCPINFORM/ {
            grok {
                match => [ "message", "(?<action>.*) from (?<src_ip>.*).* via (?<iface>.*)" ]
            }
        }
    }
}

output {

  elasticsearch {
    host => "127.0.0.1"
    cluster => "mySecretCluster"
  }
}
Nginx
The Kibana installation is placed under /var/www/kibana. And is accessible
using http://logstash/kibana
server {
    listen   80;
    root /var/www;
    index index.html index.htm;

    server_name logstash;

    location / {
        try_files $uri $uri/ /index.html;
    }

    location /elasticsearch {
        rewrite /elasticsearch/(.*) /$1  break;
        proxy_pass http://127.0.0.1:9200;
        proxy_redirect     off;
        rewrite_log on;
    }
}
Conclusions
The installation and configuration is easy and Kibana really rocks for log analysis. By customizing the logstash dashboard you’re able to create pretty powerful overviews of your log data.
As with all systems you should consider using iptables to restrict access to the necessary services and IP addresses.
Recursive chmod -> rw for files, rwx for directories
If you need to set change the attributes of all files and directories so that everyone can read (/ browse) them:
find /my/path \( -type d -exec chmod 755 {} \; \) -o \( -type f -exec chmod 644 {} \; \)This will set the following rights for directories to user = rwx (read, write, execute), group = rx, others = rx and files to user = rw, group = r, others = r.
Source: SuperUser
 marpie
 @markus_pieton